
Today, we’re revisiting a topic that we’ve covered on this blog a while back – Azure Monitoring and Alerting. The Microsoft Azure cloud provides a comprehensive set of tools – to instrument your applications with logging and provide insights on your applications through surfacing those logs and metrics and analytics in various forms. If you haven’t checked out those posts or need a refresher, here are the relevant links:
- Stay Alert with Azure: Unlocking the Power of Azure Monitor and Notifications
- Azure Monitoring and Alerts Part 2: Application Insights Availability Tests
- Azure Monitoring and Alerts Part 3: Dynamic Dashboards
In that series, we looked at a handful of ways to quickly set up some alerting with some of the built-in metrics and scenarios available on the Azure platform. However, if you are shipping your logs to a Log Analytics Workspace, you can write a customized Kusto query against that data to fine-tune the log events that you want to get alerted on. This allows you to get quite granular and selective in determining what state in your application should generate an alert.
5xx Errors in Web Application: A Real-Life Use Case
A common alert that we setup for our web applications is a 500-level server error alert. Generally speaking, a web application returns a 500 HTTP Status code when there is an uncaught exception in the application. This is usually something that we want to get alerted about and rectify as quickly as possible. One quick way to setup such an alert is to use a metric alert. You can setup the criteria for this alert to target Http5xx type of errors.
But what if you didn’t want to get alerted on every type of 5xx level errors? Recently, in an application that I’m working on, we had a situation where the app would generate 5xx level errors when it tries to reach out to another third-party API and that remote API occasionally times-out and doesn’t respond properly. There is nothing that our app can do to resolve this intermittent issue but as our alerting was based on the simple metric alert targeting all 5xx errors, we found ourselves wasting time review these and concluding that it was one of those occasional timeouts. There is nothing in this pre-canned alert that allows you to distinguish between one 5xx error versus another.
Enter Log Query Alerts
In contrast you can create an alert based on a custom Kusto query. I’ll assume that you already have an application that you have instrumented with Application Insights logging and that those logs are flowing into a Log Analytics workspace. I’ll also make an assumption here that you are familiar with querying these logs. Navigate to your Application Insights and create a custom query that you want to base your alert on.
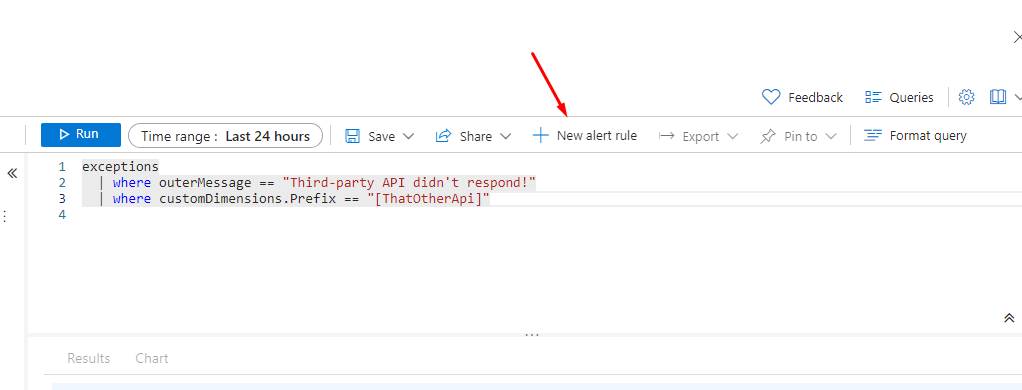
Create an Alert Rule
Once you’re satisfied with your query, click on that “New alert rule” button that appears above the query window.
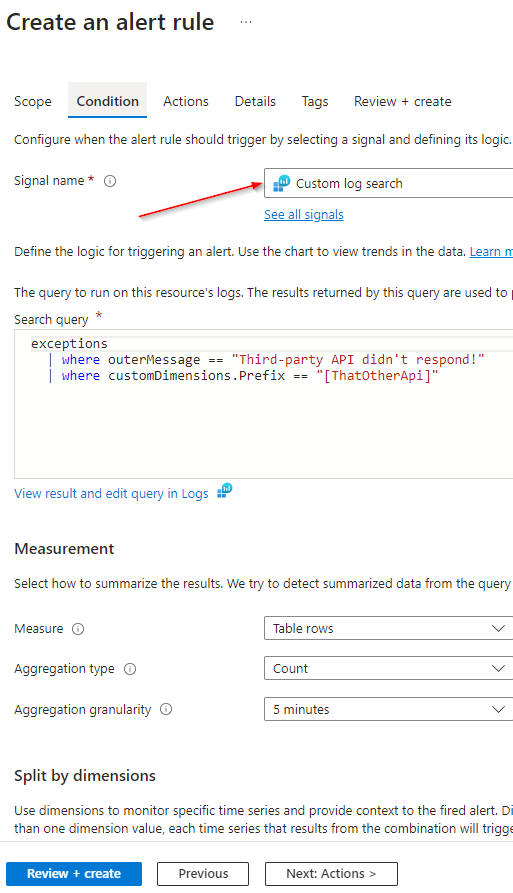
You are placed in an alert creation wizard, the same wizard that you have likely used to create your other alerts.
- Signal name is auto-selected for you as “Custom Log search”.
- Your custom query is also pre-filled.
- Complete the rest of the options such as what level of aggregation should be done, how frequently this condition should be evaluated and what action should be taken if the set threshold is met.
Review and create the Alert Rule. Next, perform an action that will trigger the log condition and verify that the alerting is working as expected.
Conclusion
Creating log-based alerting in Microsoft Azure allows you to proactively monitor and respond to critical events in your infrastructure. By following this hands-on exercise, you have set up a basic alerting system that can be extended and customized to meet your specific monitoring needs. As you gain more experience with Azure’s monitoring tools, you can explore advanced features like metric alerts, dynamic thresholds, and integration with third-party monitoring solutions.
By implementing robust alerting strategies, you can ensure the reliability and performance of your applications, providing a better experience for your users and reducing the operational burden on your team. Happy monitoring!